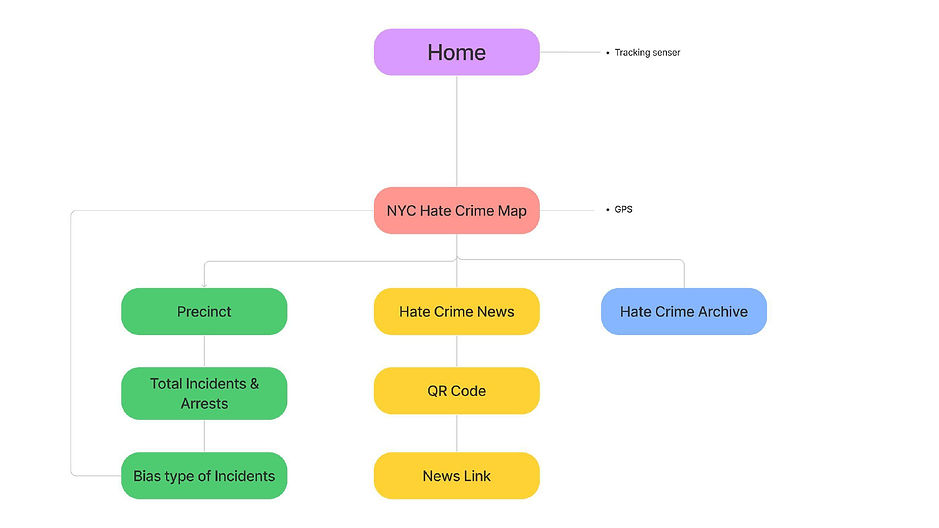
It is a design that visually expresses NYC's hate crime data on the bus stop board from 2017 to 2021. By expressing data visualization, users can easily check what motivations the criminal caused the crime and the number of incidents in each precinct.